
Madden 21 Scouting Guide (Part 1) – How Combine Results Affect Physical Attributes
Note: Our Madden 23 Scouting/Draft Guide Can Be Found Here
The most popular franchise related request during the first month of Madden 21 was for a guide that helps with scouting. Over the next few weeks we will be running tests on the scouting system in franchise mode to help get you an edge in your rookie drafts.
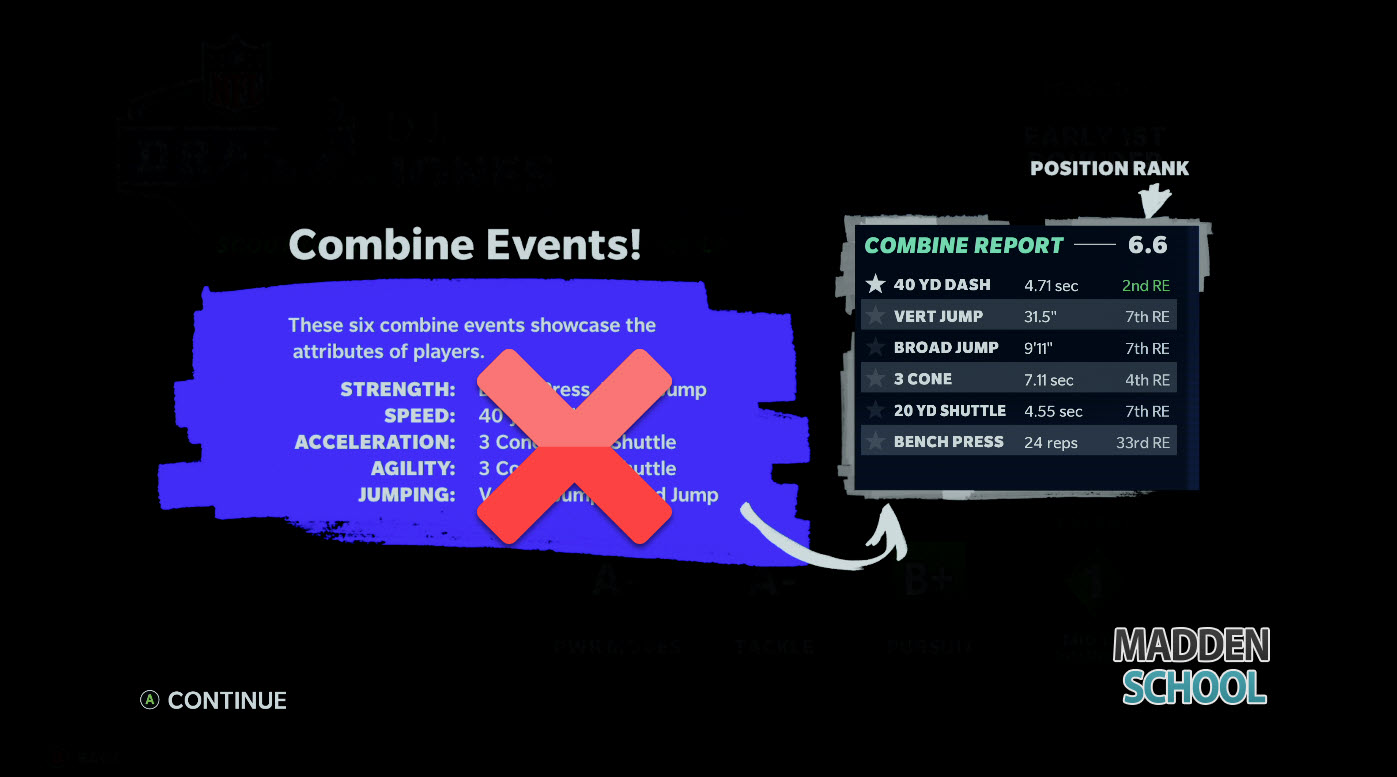
Today we are starting with the physical combine traits like 40 yard dash, vertical jump, broad jump, 3 cone drill, 20 yard shuttle, and bench press.
We are going to go over what each of those scores tell you as well as the attributes they correspond with on a player.
This is part 1 of a multi-part series on drafting in Madden 21. Check back every few days for more.
Let’s dive in!
40 Yard Dash & Speed Rating
Let’s start first with everyone’s favorite combine metric, 40 yard dash. As many of you already know, the 40 yard dash impacts your player’s speed rating. It is the only number that matters for speed and there is a direct correlation between 40 yard dash time and speed rating in game.
Even though there is clearly a correlation, it isn’t as easy as just _____ 40 yard dash time = ______ speed. That would be too easy and would take away part of the fun of drafting. Instead, there is a speed range that any given 40 yard dash time can fall into.
For example, if a player runs a 4.51 second 40 yard dash, he can fall anywhere between 87 speed (on the low end extreme) and a 91 speed (on the high end extreme) with most of the time that player having an 88 or 89 speed rating.
Before we get into the numbers, we should first go over the methodology. Our first step was to confirm our suspicion that 40 yard dash time was the only number that impacts speed. That was relatively simple enough to do and we can confirm that is the case.
Once we verified that, we had to confirm that 40 yard dash times are standardized for all positions. For example, a 4.65 second 40 yard dash time for a halfback corresponds to the same speed rating as it does for an offensive lineman or defensive back that ran the same time. Basically position doesn’t matter. We can also confirm that is the case.
At that point it just came down to editing 20 players at each speed rating and recording their 40 yard dash times. Obviously, the more data you gather, the more accurate your information will be. We would have liked to do more than 20 players at each speed rating but even at 20 players per speed rating, it is an insane time commitment to gather the data. That being said, 20 is more than enough to get a very accurate sense of the 40 yard dash time ranges and we are very confident in our findings.
We started at 80 speed and went up to 99 speed in order to keep the speed section at a reasonable length. So if you care deeply about the exact speed of a guy who runs a 4.97 yard 40 yard dash time, this post may not help you. Other than that, the data presented below should be very helpful.
Let’s dive into it and then we’ll explain it in more detail below.
- 80 Speed – Average 40 Time 4.76 (Range 4.71-4.83)
- 81 Speed – Average 40 time 4.74 (Range 4.67-4.80)
- 82 Speed – Average 40 time 4.72 (Range 4.65-4.77)
- 83 Speed – Average 40 time 4.67 (Range 4.62-4.72)
- 84 Speed – Average 40 time 4.65 (Range 4.59-4.70)
- 85 Speed – Average 40 time 4.62 (Range 4.56-4.68)
- 86 Speed – Average 40 time 4.58 (Range 4.53-4.66)
- 87 Speed – Average 40 time 4.56 (Range 4.51-4.61)
- 88 Speed – Average 40 time 4.54 (Range 4.49-4.59)
- 89 Speed – Average 40 time 4.52 (Range 4.45-4.58)
- 90 Speed – Average 40 time 4.48 (Range 4.44-4.53)
- 91 Speed – Average 40 time 4.45 (Range 4.40-4.51)
- 92 Speed – Average 40 time 4.42 (Range 4.37-4.44)
- 93 Speed – Average 40 time 4.40 (Range 4.34-4.46)
- 94 Speed – Average 40 time 4.37 (Range 4.33-4.42)
- 95 Speed – Average 40 time 4.36 (Range 4.30-4.42)
- 96 Speed – Average 40 time 4.30 (Range 4.26-4.39)
- 97 Speed – Average 40 time 4.30 (Range 4.28-4.34)
- 98 Speed – Average 40 time 4.28 (Range 4.24-4.32)
- 99 Speed – Average 40 time 4.25 (Range 4.24-4.30)
Let’s go over what these numbers mean.
Maybe you are scouting a guy who ran a 4.45 second 40 yard dash time. We look on the chart above to see that a 4.45 looks to be on average 91 speed. But we know there is a range, so we look to see the high end and low end of the range. On one end, we see that 4.45 could be as low as 89 speed and on the other end, we see that 4.45 could be as high as 93 speed.
So in that scenario, we expect that player be somewhere around 91 speed but don’t be surprised if it is 2 points higher or lower in either direction.
You can use that same technique to look up any player’s projected speed given that the combine results are live and you have his 40 yard dash time.
Vertical Jump & Jump Rating
Before we get started going over how te Vertical Jump combine result impacts your jump rating, it is important to note that the “Broad Jump” combine result is 100% useless and doesn’t factor into jump, strength, or any other rating as far as we can tell. It is safe to completely ignore broad jump.
Vertical Jump on the other hand is directly correlated with the jump rating your player receives. It is the only rating that matters for it, and it is pretty straightforward.
There is still a bit of a range but it isn’t nearly as wide as the speed/40 yard dash ratings.
The table below goes over what you can expect based on vertical jump results in the combine.
- 43 inches or more = 99 jump
- 42-42.9 inches = 97-98 jump
- 40-41.9 inches = 93-96 jump
- 38-40 inches = 90-93 jump
- 37-37.9 inches = 88-89 jump
- 35-36.9 inches = 85-87 jump
- 32.5-34.9 inches = 80-84 jump
The table above has much less variablity than what takes place with speed. So for example if you are scouting a player with a 41.7 inch vertical jump, it is just about guaranteed that he will have 95 or 96 jump. And if you scout a guy with a 40.1 inch vertical jump, he is just about guaranteed to have 93 or 94 jump.
Most people only really care about guys with super high jump ratings. For most people, if a player has 72 jump vs 78 jump that won’t impact whether or not he get’s drafted so that is the reasoning this test was kept to only relatively high values.
3 Cone Drill & Acceleration and Agility
The 3 cone drill takes a player’s acceleration and agility ratings into account. Acceleration and Agility are the only 2 ratings that impact your 3 cone drill time.
This one isn’t as straight forward as some of the other combine scores but we can still get a lot of good information from it.
In an overly simplistic way, the way it works is it adds together your acceleration rating and your agility rating and gives you the 3 cone drill time. That’s the basics and really all anyone needs to know on a practical level.
If you are interested though, it is really a weighted average with acceleration impacting the 3 cone drill number slightly more than agility does. This concept can be a bit confusing so I’ll attempt to explain it with some examples below.
Let’s say a player has 90 acceleration and 90 agility. That player will always have a 3 cone drill time of 6.89 seconds (give or take 1/100th of a second).
But let’s take another player with 88 acceleration and 92 agility. When you add those 2 numbers together you still get 180 total (like in the 90 acc/90 agi example) but this player will have a slightly slower 3 cone drill time than the player with 90 acceleration and 90 agility.
A player with 92 acceleration and 88 agility will have a slightly faster 3 cone drill time than the 90 acceleration and 90 agility player.
This is because the acceleration rating carries slightly more weight in the calculation than the agility rating. Practically, this doesn’t tell us much but it is something to keep in mind as we go through the chart below.
In most players you are interested in drafting, their acceleration rating and their agility rating will be very close to one another. You won’t find too many players with 94 acceleration and 82 agility. It will generally be something like 90 acceleration and 88 agility.
Because of this we decided to keep acceleration and agility the same for each player in our tests. So we did tests with 80 acceleration and 80 agility and then 81 acceleration and 81 agility and so on until we reached 99 acceleration and 99 agility.
Given all this information, you should be able to get a pretty good guess as to a player’s acceleration and agility given the table below.
- 80 Acc/Agi – 7.34-7.36 Second 3 Cone Drill
- 81 Acc/Agi – 7.29-7.31 Second 3 Cone Drill
- 82 Acc/Agi – 7.25-7.27 Second 3 Cone Drill
- 83 Acc/Agi – 7.20-7.22 Second 3 Cone Drill
- 84 Acc/Agi – 7.15-7.17 Second 3 Cone Drill
- 85 Acc/Agi – 7.11-7.13 Second 3 Cone Drill
- 86 Acc/Agi – 7.06-7.08 Second 3 Cone Drill
- 87 Acc/Agi – 7.01-7.03 Second 3 Cone Drill
- 88 Acc/Agi – 6.97-6.99 Second 3 Cone Drill
- 89 Acc/Agi – 6.92-6.94 Second 3 Cone Drill
- 90 Acc/Agi – 6.88-6.90 Second 3 Cone Drill
- 91 Acc/Agi – 6.83-6.85 Second 3 Cone Drill
- 92 Acc/Agi – 6.78-6.80 Second 3 Cone Drill
- 93 Acc/Agi – 6.74-6.76 Second 3 Cone Drill
- 94 Acc/Agi – 6.69-6.71 Second 3 Cone Drill
- 95 Acc/Agi – 6.64-6.66 Second 3 Cone Drill
- 96 Acc/Agi – 6.60-6.62 Second 3 Cone Drill
- 97 Acc/Agi – 6.55-6.57 Second 3 Cone Drill
- 98 Acc/Agi – 6.50-7.52 Second 3 Cone Drill
- 99 Acc/Agi – 6.47 Second 3 Cone Drill
Let’s do an example with this table. Maybe we are interested in a player with a 6.85 second 3 cone drill. We look at the chart above and see that number falls around 91 acc/agi. So we expect somewhere around 182 points (91+91) to be split between acceleration and agility.
But remember this isn’t exact because acceleration is weighted more heavily in the calculation. So the 6.85 second 3 cone drill could instead result in only 180 points if there is a wide gap between acceleration and agility. For example 94 acceleration and 86 agility. Or in a much rarer situation, it could be 184 points if a player has much more agility than acceleration. For example 96 agility and 88 acceleration.
This isn’t an exact science and there is no way of knowing exactly what you will get for acceleration and agility but we can get a pretty close guess once we know the 3 cone drill results. Especially once we use the 20 yard shuttle information that we are going to cover below.
20 Yard Shuttle & Agility And Change Of Direction
The 20 yard shuttle works almost exactly the same as the 3 cone drill just this time instead of taking acceleration and agility into account, it takes agility and change of direction into account.
This time agility is the higher weighted attribute and change of direction is the lower weighted attribute.
That all being said, we’ll just dive right into our results and go over what they mean below.
- 81 AGI/COD – 4.43-4.45 Second 20 Yard Shuttle
- 82 AGI/COD – 4.39-4.41 Second 20 Yard Shuttle
- 83 AGI/COD – 4.36-4.38 Second 20 Yard Shuttle
- 84 AGI/COD – 4.32-4.34 Second 20 Yard Shuttle
- 85 AGI/COD – 4.29-4.31 Second 20 Yard Shuttle
- 86 AGI/COD – 4.25-4.27 Second 20 Yard Shuttle
- 87 AGI/COD – 4.22-4.24 Second 20 Yard Shuttle
- 88 AGI/COD – 4.18-4.20 Second 20 Yard Shuttle
- 89 AGI/COD – 4.15-4.17 Second 20 Yard Shuttle
- 90 AGI/COD – 4.11-4.13 Second 20 Yard Shuttle
- 91 AGI/COD – 4.08-4.10 Second 20 Yard Shuttle
- 92 AGI/COD – 4.04-4.06 Second 20 Yard Shuttle
- 93 AGI/COD – 4.01-4.03 Second 20 Yard Shuttle
- 94 AGI/COD – 3.97-3.99 Second 20 Yard Shuttle
- 95 AGI/COD – 3.94-3.96 Second 20 Yard Shuttle
- 96 AGI/COD – 3.90-3.92 Second 20 Yard Shuttle
- 97 AGI/COD – 3.87-3.89 Second 20 Yard Shuttle
- 98 AGI/COD – 3.83-3.85 Second 20 Yard Shuttle
- 99 AGI/COD – 3.81-3.82 Second 20 Yard Shuttle
Remember, your Agility rating and Change of Direction rating won’t always be the same. They will generally be pretty close though.
So for this example, we’ll imagine a player with a 4.17 second 20 yard shuttle time. When we look at the table above, we see that it means he will probably be somewhere around 89 agility and 89 change of direction or 178 total points to split between the 2 ratings.
Just like with before, it can be more points or less points depending on which attribute those points are in but we will generally be pretty close.
One thing to consider here is if we have a relatively poor 20 yard shuttle time paired with a relatively high 3 cone drill time, that will often mean that the player will have higher acceleration and lower agility.
This isn’t an exact science but you can generally get a feel for it if you see a player is rated as the 1st best 3 cone drill at his position and the 8th best 20 yard shuttle at his position.
The same thing works the other way around. If you see a player with the 1st best 20 yard shuttle drill and the 10th best 3 cone drill, it is a pretty safe bet that he will have more agility and less acceleration (at least compared to the other players at his position).
Strength & Bench Press
Before we get started with how bench press corresponds to strength, we should note that the game claims that broad jump has some impact on strength. This is false. Broad jump does not impact strength in any way. The only combine score that impacts strength is the bench press.
Strength and bench press work very similiarly to how speed and 40 yard dash time work. The bench press results gives us a range of strength ratings with the actual rating most likely to fall somewhere in the middle.
Just like with the other ratings, we only tested ratings from 80-99. You can check out our findings below.
- 80 Strength – Average Bench Press 26.5 (Range 25-29)
- 81 Strength – Average Bench Press 27.5 (Range 25-29)
- 82 Strength – Average Bench Press 28.5 (Range 26-30)
- 83 Strength – Average Bench Press 29.1 (Range 27-31)
- 84 Strength – Average Bench Press 30.5 (Range 28-32)
- 85 Strength – Average Bench Press 31 (Range 29-33)
- 86 Strength – Average Bench Press 32.1 (Range 30-34)
- 87 Strength – Average Bench Press 32.2 (Range 31-35)
- 88 Strength – Average Bench Press 33.5 (Range 32-36)
- 89 Strength – Average Bench Press 34.5 (Range 33-37)
- 90 Strength – Average Bench Press 35.8 (Range 34-38)
- 91 Strength – Average Bench Press 36.5 (Range 35-39)
- 92 Strength – Average Bench Press 36.8 (Range 36-40)
- 93 Strength – Average Bench Press 38.3 (Range 37-41)
- 94 Strength – Average Bench Press 39.8 (Range 38-42)
- 95 Strength – Average Bench Press 41.7 (Range 39-43)
- 96 Strength – Average Bench Press 41.8 (Range 40-44)
- 97 Strength – Average Bench Press 43.8 (Range 42-46)
- 98 Strength – Average Bench Press 45.1 (Range 43-46)
- 99 Strength – Average Bench Press 45.7 (Range 45-46)
The numbers for strength and bench press are pretty straightforward. For example, if you are scouting a player with 34 bench reps, he could have a strength rating anywhere from 86-90 but there is a good chance that he will have an 88 or 89 strength rating.
If you are scouting a player with 40 bench reps, he could have anywhere from 92 strength (on the low end) to 96 strength (on the high end) but we expect probably somewhere around 94.
An interesting observation on the ranges above is that for most of the part, everytime the bench press results go up 1 rep, the strength range goes up 1 point on both the low and high ends.
Now check out part 2 of this guide where we go over positional grades and how they relate to ratings.
If you missed our deep dive on skill points, XP, and progression in Madden 21, we encourage you to check that out here.

Love this new content! Just started my 4 man user franchise last weekend and will use this valuable information to stay a step ahead of them! Thanks!
Awesome, glad to help!
Can you look at safeties soon, the scouting seems to have changed a lot from last year.
Should you youse scouting points before combine or after
Use them in full every week.
Do combine stats lead to potential increase in overall rating if I were to draft a player at one position and move them to another position? What I mean by that is, if I draft a pass coverage LB and move them to SS, or if I draft a big bodied physical WR and move them to TE, or a power rusher DE weighing over 300 lbs and move them to DT. For players of potential position change, can we tell if their overall grades may increase from a position change due to certain combine stats and scouted abilities?
still accurate for M22?